Wednesday May 30
|
| ||||
1. What would you do if you won the Lottery? Have students share, then inform them that they have already by being born into Western Society. This geography unit will show them that every day. Discuss what "human geography" is
branch of geography that focuses on the study of patterns and processes that shape human interaction with the environment, with particular reference to the causes and consequences of the spatial distribution of human activity on the Earth's surface.
2. Show the video clip 7 billion, discuss what students found interesting in the clip
3. Read over unit outline to discuss what the unit will consist of
4. Scavenger Hunt for Population Notes
5. Discuss notes
|
|
|
Thursday May 31
|
|
|
|
|
|
1. Video – Miniature earth (3:20)
-Who has traveled and seen the items listed in the clip?
2. Go over notes from yesterday
3. Open book test on French/English and Aboriginal Relations and Immigration policy
4. Complete Demography assignment. We will go over it tomorrow.
-Who has traveled and seen the items listed in the clip?
2. Go over notes from yesterday
3. Open book test on French/English and Aboriginal Relations and Immigration policy
4. Complete Demography assignment. We will go over it tomorrow.
| demographer_assignment.doc |
Friday June 1
|
|
|
1. Go over Demography assignment.
2. Have students read Text book section on Population control in india and China. Share one interesting fact. Read the Section on Population Theories and do the same. Show the Crash Course video.
2. Have students read Text book section on Population control in india and China. Share one interesting fact. Read the Section on Population Theories and do the same. Show the Crash Course video.
| malthus_and_china_one_child_policy.doc |
Monday June 4
|
|
| ||||||
1. Challenge students to all fit in the small box. If the whole class, standing on at least one leg, can fit in I will give them a candy. Link to population density. Have two students come up to the front of the class and ask them to stand as close as they can until they feel uncomfortable. Discuss how places in Asia do not have the same concept of personal space as North Americans do because their population density is so much greater. Look at picture on pg. 358.
2. Ask the class "Would you rather have 1 million dollars today, or get a penny a day that doubles every day of the month. For instance, on day one you would get 1 penny, on day 2, you would get 2 pennies, on day 3, you would get 4 pennies, on day 4, you would get 8 pennies....). Review population grows exponentially with penny experiment.
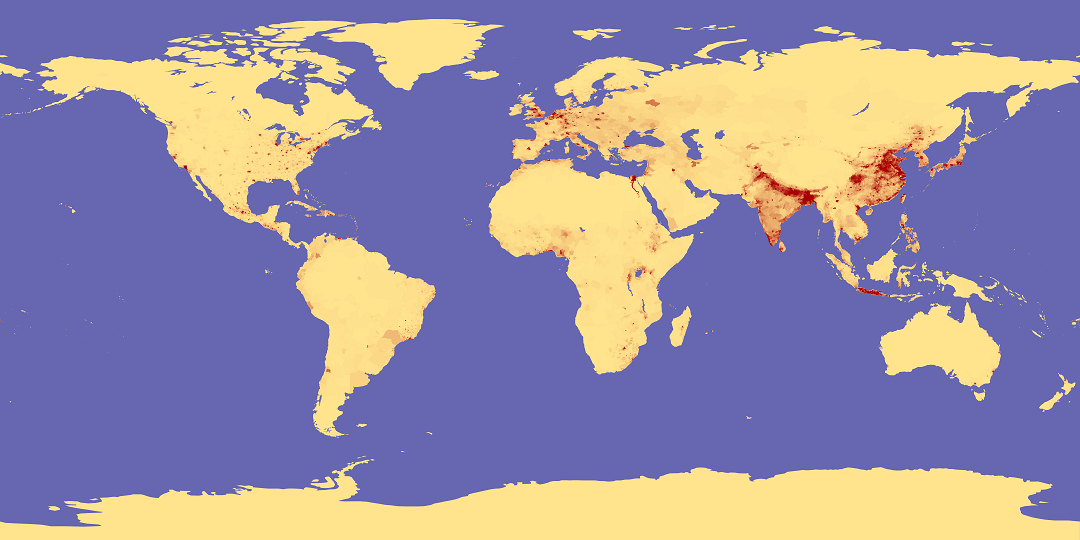
3. Slideshow on Population Density – where do most people live? (Near equator, why?-warm). Where do most Canadians live. Discuss what the Malthusian ideas of population expansion were. We will watch a powerpoint of "Population Cartoons." This will help to review the issue of an expanding population. Tie in with Malthusians and the term “Carrying Capacity.” Also, Mrs. Fitton will explain “Nutritional Density” – How much nutrition in calories can be produced from the land. (More in china, as some rice can grow three crops per year, whereas only one/two crops in lower mainland of BC).
4. Go over Population density chart. Pg. 382 Explain this is showing why people live in certain areas
5. P. 373-74, Good/Bad aspects of aging population. Show:
http://www12.statcan.ca/english/census01/products/analytic/companion/age/cda01pymd.cfm to discuss Canada's population pyramid over the last 100 years
2. Ask the class "Would you rather have 1 million dollars today, or get a penny a day that doubles every day of the month. For instance, on day one you would get 1 penny, on day 2, you would get 2 pennies, on day 3, you would get 4 pennies, on day 4, you would get 8 pennies....). Review population grows exponentially with penny experiment.
3. Slideshow on Population Density – where do most people live? (Near equator, why?-warm). Where do most Canadians live. Discuss what the Malthusian ideas of population expansion were. We will watch a powerpoint of "Population Cartoons." This will help to review the issue of an expanding population. Tie in with Malthusians and the term “Carrying Capacity.” Also, Mrs. Fitton will explain “Nutritional Density” – How much nutrition in calories can be produced from the land. (More in china, as some rice can grow three crops per year, whereas only one/two crops in lower mainland of BC).
4. Go over Population density chart. Pg. 382 Explain this is showing why people live in certain areas
5. P. 373-74, Good/Bad aspects of aging population. Show:
http://www12.statcan.ca/english/census01/products/analytic/companion/age/cda01pymd.cfm to discuss Canada's population pyramid over the last 100 years
http://www12.statcan.ca/english/census01/products/analytic/companion/age/cda01pymd.cfm

Tuesday June 5
| lesson_5_-_population_cartoons.ppt |
Reminders: Quiz on Population Thursday January 22; study unit vocabulary, hand it in for bonus marks.
1. Review Density and what contributes to where people live. Review Population control charts in India and China. Show Population Cartoons in powerpoint
2. Read Page: 380 – define Ecumene, the video talks about four of these areas experiencing population crises
3. Video from Library: NOVA “World in the Balance: Population Paradox” Play section from Beginning to 2:47 for a general intro, 4:30-16 min for section on India and 34:30-51:00. Deals with USA and pollution and population. Also, Demographic transition model, Africa, AIDS. (45 minutes to 53)
4. Ask them to make a T-chart and take notes on the challenges associated with population growth and the Solutions
5. Begin Population Pyramid Assignment
6. Work on vocab if done early.
Wednesday June 6
|
|
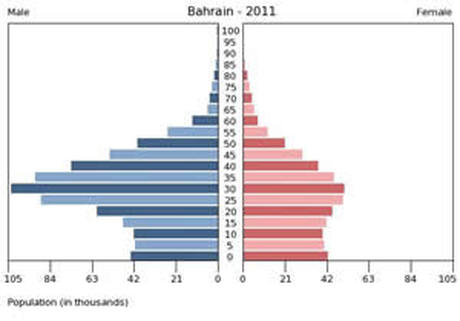
1. Get into groups of 4, Each group will come and choose a population pyramid for a developing nation and a developed nation and answer the questions about population pyramids. They will glue or tape the population pyramid to chart paper and write the questions below it.
Do an example with the Population Pyramids above. 8. Review Activity: View these odd pyramids and discuss (China - one child policy look at cohorts of 5-14 year olds).- Bahrain why would there be so many more men in this middle eastern country?" Class has to hypothesize.
Questions
1. Look at each graph and compare them to the Demographic Transition Model. Identify the stage that you think each of your graphs fits into (page 366 of Counterpoints) Remember the DTM is different than population pyramids.
2. Describe the shape of each graph in relation to your notes: Is it an early expanding, expanding, stable or contracting pyramid? How do you know?
3. What age groups (cohorts) hold the largest percentage of the population for each graph? Give possible reasons for the differences between your two countries. What problems result from a country with a large dependency ratio? What issues comes from a population with a large number of adults 16-64 and a low number of young children?
4. For each country try to make some general statements about what is happening to the population (why is your graph the shape it is? Ie: Famine, War, healthcare, etc)
5. Write down as many reasons as you can think of to explain the differences in the graphs for the different countries. Be as specific as possible in trying to link the reason with how it affects the graph.
6. Think critically about what the graph foretells about the future of the country. What social, political and economic factors contributed to the pyramid shape, and what will result socially, politically and economically due to the trend. Also, offer solutions to the problem and specify what might stand as a barrier to the implementation of those solutions. (Ie: religious views in an Islamic country might prohibit female education or birth control which will result in population increases and further strains on social programs.)
3. Present
Thursday June 7
1. Mrs. Richardson's Tanzania Presentation
Friday June 8
|
|
|
1. Introduce Poverty by reading the Scott Feschuck article on KFC. What does this show us about our society?
Play from 0-5:31 “Coney Island Hotdog Eating Contest” to show the disparity between rich nations and poor nations. How about this clip?
2. Show them the Website: http://globalrichlist.com/ If you even make minimum wage in Canada you are considered rich in the world.
3.Show the Clip: (We’re all in this together) to illustrate the discrepancy between Living Standards in the developed world vs. the developing world.
4. Go through powerpoint on poverty and Human Development Index. Students will take notes as we go through it. Read pg. 398 for example of Kenya trapped in the poverty cycle
5. Work on Vocab for ch. 14 if done early and the major determinants of health sheet
|
|
| ||||||
Monday June 11
1. Review key points of slideshow, review the HDI and emphasize why it is hard to get out of debt.
Mini Oral Quiz
a. What is the difference between a want and a need?
b. What is the poverty line in Canada? Worldwide?
c. What are the three ways the UN determines an HDI number?
d. Briefly describe the poverty cycle
e. Name any of the five major causes of poverty (natural disaster, lack of education, mounting debt, lack of resources, war and conflict)
f. List one way to help solve it (IMF, World Bank, Forgiving Debt
3. Foreign debt Pennies (10) -Provide students with their sheets and ask Qs. See activity from Engaging Students Through Global Issues – Activity Based Lessons and Action Projects – “What’s Debt Got to Do with It?)
After the activity, ask the following questions:
1. What happened in year 3 and 4 when you had allocated most of your money to debt? How did it affect other areas of development? How would investment in Health, education and infrastructure contribute to a poor countries’ development?
2. When you didn’t have to put money on debt, where did you put it and why?
3. Do you think it is fair that countries ask you to pay back loans and interest, even if there is no money for medicine and schools? Would it be fair if loaning countries never got their money back?
4. Who bears the responsibility for the debt cycle? The IMF and World Bank who lend the money, or the countries who borrow it?
5. How might cycles of debt actually benefit a rich country?
6. Should aid be tied to human rights?
4. Show the the "Girl Effect" videos
5. Ask students to make a list of what they do in a typical day. Then ask them to turn to page 402 of textbooks and compare to Amina’s (of Zambia) day.
When discussing this, have 10 volunteers go outside and carry a book on their head, must make it to the other end of the grass without dropping or will have to turn back and start again. This is frustrating for three minutes, imagine how frustrating it would be if you had to do it to get water for three hours every day.
6. Then, turn to page 388 and 403 (for women). Identify which continent has the most countries with the lowest literacy rates. (Africa)
7. Using the section on “Women in Niger”, have students web the living conditions of a woman in this poor country. Should look like the web on the rear of the lesson page: Or just show them the web. Watch the clips below on the "Girl Effect"
8. Watch the TED talk on the status of women
|
|
|
|
Tuesday June 12
|
|
|
|
|
|
|
| chapter_14_overview__world_health_crisis_on_rear.doc |
1. Notes on Status of Children in the world – students are to copy off the board. + Show women in Nigeria chart.
Two Organizations that help women and children in the world:
International Labour Organization (ILO)
-246 million children are exploited in child labour around the world
-1.2 million are trafficked into the commercial sex trade each year
-Over 300 000 child soldiers are involved in armed conflict
United Nations International Children’s Emergency Fund (UNICEF)
-Active in 158 countries around the world
-Created after WWII to provide children with food, clothing and medicine
-1959 – Declaration of the Rights of the Child
-1989 – Convention on the Rights of the Child (human rights treaty)
Amnesty International
-Interested in protecting human rights for all, but focus on women and children
-Draws attention to abuses of human rights and tries to lobby gov’t to comply with int’l law
Areas these groups are concerned with
U5MR (Under 5 Mortality Rate)
AIDS
Girls’ Education
Child Labour
Immunizations
Read pages 404- 408 and make Cornell Notes on the section on Children in Crisis. Only should have 3-4 points per section at most.
2. Review the names of agencies concerned with children and what they are most concerned with. Discuss the major point of children in crisis in the textbook. When discussing Children in war, talk about Child soldiers. Show facts and stories overheads.
Show video clips:
Blood Diamond 2:45-6:00 abducting children to become soldiers
Invisible Children Clips
Part 3 8:44-end. Invisible Children, explains how they are abducted and trained
Part 4 show beginning to 6 minutes in, telling about plastic bag condoms
Part 6 (4:00-end) Saying not to forget them.
Child Labour videos
3. Unit Overview: Read unit overview for Chapter 14. On back is in-class assignment “World Health Crisis” 15 minutes, then as a class we will go over the answers.
4. Major Determinants of Health (pg. 411) assignment. Have students take handout on “Major determinants of Health” and get them to find the answers. On rear of the sheet is Unit Vocabulary.
5. Work on World Heath Crisis assignment on the back of the chapter overview
-Discuss Pandemics (and then do the cholera map with snow.)
-See if students could guess. They get twenty questions.
-Students are mysteriously sick due to something in Maggie.
-Local to the school. No treatment or modern testing equipment.
-How do we find out why they are sick and how to stop the spread.
-Do it with them as examples. As time ticks down (they get three minutes…) students in the class start dying. 5 for every minute they don’t get the answer.
-Show cholera map and pandemic.
6. Go over the answers to the World Health Crisis Sheet
| snow_and_broadstreet_pump.ppt |
Wednesday June 13
1. Go over organizations that help children notes
2. Watch videos on Child soldiers
3. World Health Crisis worksheet
2. Watch videos on Child soldiers
3. World Health Crisis worksheet
Thursday June 14
1. Watch "Living on a Dollar a Day" and answer the essay question: Discuss the problems facing the developing world and possible solutions. Discuss their answers after the video.
Friday June 15
|
|
| ||||||
1. Sustainability notes:
2. Discuss how the world food source is overused by certain nations
3. Show students a pie chart that represents the world population in a pie chart. (get students into groups where they get to represent a portion of the globe. Explain that I have brought cookies for them to share.
(For a class of 30 --- Africa=(4) US/Canada=(2) Latin America=(3) Europe=(4) Asia=(17), For a class of 20 Africa (3), US/Can = 1, Latin America 2, Europe 2, Asia 12.
4. Have 20 cookies (which represent the world food supply. In groups they get cookies. Can allow immigration if they want. (Should make signs for their countries) – review immigration/emigration.
Asia (40% = 7 cookies)
Latin America (10 %= 2 cookies)
Canada/US (25% 5 cookies)
Africa (5% = 1 cookie),
Europe (25% = 5 cookies)
-How does each region feel about the distribution? This represents environmental scarcity, there just aren’t enough of any particular resource for everyone who wants or needs it
-What should you do about it? (may see immigration/discrimination, brain drain à only our friends (people with degrees can have it, or conflict (fighting over it)
-How do you feel about how much others got? Did you do anything to deserve more or less cake? What are real examples of people trying to get more cookies? What are the ethical, social and security implications of this inequity?
5. . Go back into the notes by talking about water
-Ask them what requires water? Put under headings of domestic/industrial/agriculture
-Show the class a gallon of water
-take out 2.5% (3 tablespoon + one teaspoon) and place in a clear container to represent the amount of fresh water on the earth
-of this amount, remove 70% (2 tablespoons) to represent the amount of water trapped in glaciers or too deep in the ground to be realistically recovered.
-The remainder (less than 1% of the Earth’s total water supply) is left to support human needs for agriculture, drinking, and washing as well as for lakes, rivers, and fresh water ecosystems
Reflection Questions:
1. Given that there is a fixed amount of fresh water on the planet, what do you think will happen to the distribution of the water resources as the global population grows?
2. What happens when people do not have enough water to meet their basic needs?
3. What happens when a fresh water resource is polluted?
4. How does the greater use of water resources in developed countries affect the availability of water resources in water-scare countries?
6. Do the water Trivia Quiz. Exchange and mark. Give a prize for the highest mark
7. Begin notes on Water
9. Do questions on what happens when water supplies are contaminated. Then discuss answers OR Make a t-chart on Threats to Water Supply and Solutions. Use pages 432-436
Monday June 18
1. Finish water questions and review sustainability and carrying capacity. Have a student see how many other students he can carry to demo carrying capacity
2. Do notes on Ecological footprint. Do activity when they are finished recording notes. Ecological Footprint -www.myfootprint.org Discuss results
3. Show Diaper Clip from National Geographic Human Foot Print documentary
4. Do Ozone depletion notes
5. Show cartoon on Global Warming from An Inconvenient Truth: Global Warming Cartoon + Basic Science of Global Warming: 9:02-12:00
6. Do notes on Global Warming
7. Show the following clips from An Inconvenient Truth
Graph of C02 over earth’s history: 14:02-23:00 (or 25:00)
Permafrost/Global Warming + Arctic: 42:00-49:10
Water Covering Earth if ice shelves melt: 59:00-1:01:00
How can we make changes 1:22:00-1:25:00
-Mention the McKenzie pipeline and how it is sinking because of a lack of permafrost, which is ironic because it is carrying the oil that is helping cause Global warming
6. Canadians for global warming:
-Discuss some benefits – shipping routes open up, more arable land, ecumene areas improve, some animals have larger roaming areas. Warmer climate, longer growing season, less heating costs, more arctic char, bring people together to combat problem.
-Bad: releases more methane in arctic because of melt, oceans rise, disease spread, melt glaciers, disease ranges extend, polar bears starve, less ski season, larger population density, algae blooms, ocean convection currents.
7. Create a drawing that explains the difference between Global Warming and Ozone Depletion
|
|
|
|
|
|
|
|
|
|
|
|
|
Monday June 18-Wednesday June 20
1. Geography creative project
Thursday June 21
1. First investigation
Friday June 22
1. Second investigation
